Note: Before you begin, remember that the Azure platform is continuously evolving, so some elements may differ from what’s shown here, such as the location of specific features. Be sure to check for any updated guidance in comments or search online for the latest steps.
User Feedback and Changes
Here are some changes and workarounds suggested by users in YouTube comments who completed the lab at a later time:
Extract Option: The Extract option may not be available anymore. You can now use the following query to get raw data without training:( FAILED_RDP_WITH_GEO_CL | extend latitude = extract("latitude:([0-9.-]+)", 1, RawData), longitude = extract("longitude:([0-9.-]+)", 1, RawData), destinationhost = extract("destinationhost:([^,]+)", 1, RawData), username = extract("username:([^,]+)", 1, RawData), sourcehost = extract("sourcehost:([^,]+)", 1, RawData), state = extract("state:([^,]+)", 1, RawData), country = extract("country:([^,]+)", 1, RawData), label = extract("label:([^,]+)", 1, RawData), timestamp = extract("timestamp:([^,]+)", 1, RawData) | project TimeGenerated, Computer, latitude, longitude, destinationhost, username, sourcehost, state, country, label, timestamp)
Map Display Query: To display the raw data on the map and autofill the map settings, you can run:( FAILED_RDP_WITH_GEO_CL | extend latitude = extract("latitude:([0-9.-]+)", 1, RawData), longitude = extract("longitude:([0-9.-]+)", 1, RawData), destinationhost = extract("destinationhost:([^,]+)", 1, RawData), username = extract("username:([^,]+)", 1, RawData), sourcehost = extract("sourcehost:([^,]+)", 1, RawData), state = extract("state:([^,]+)", 1, RawData), country = extract("country:([^,]+)", 1, RawData), label = extract("label:([^,]+)", 1, RawData), timestamp = extract("timestamp:([^,]+)", 1, RawData) | project TimeGenerated, Computer, latitude, longitude, destinationhost, username, sourcehost, state, country, label, timestamp | summarize event_count=count() by sourcehost, latitude, longitude, country, label, destinationhost | where destinationhost != "samplehost" | where sourcehost != "")
Project Description
In this project we ‘re setting up Azure Sentinel (a cloud-based SIEM) as well as a Virtual Machine (VM) in the cloud which we ‘re making intentionally vulnerable to the Internet (honeypot). Then we ‘re monitoring and logging attacks from different IP addresses from around the world. We will be displaying the data on a map to see where the attacks are coming from. In short, we’re capturing the attacker’s IP address, retrieving its geographical data, and sending it to Azure for mapping.
While a core function of a SIEM is to create triggers and alerts, we’re skipping that in this lab for simplicity. Instead, we’re focusing on extracting failed login data, ingesting it into Sentinel, and mapping it on a world map to visualize the origin of attacks.
Key Steps
- Create an Azure Subscription. It asks for a credit card but you get one month free with no automatic renewal and 200$ worth of credit. Remember to delete your resources at the end of the lab to avoid potential charges.
- Create a VM in Azure. Turn off the external firewall for that VM and turn off its Windows firewall. That is something we purposely do to give everyone the ability to discover it and ping it from anywhere in the world.
- Set up a Log Analytics Workspace in Azure to serve as a central repository for ingesting logs from the VM.
- Deploy Azure Sentinel, Microsoft’s cloud-native SIEM, within Azure. It enables us to map attacker data, providing insights such as the attackers’ countries of origin and other relevant information.
- Run a PowerShell script to extract the IP address from a failed Windows login attempt and send it to a third-party API (IPGeolocation). The API returns useful geographic details—such as latitude, longitude, state, and province—which are sent back to our VM. This data is then recorded in a custom log file (
failed_rdp.log) containing the geographic information.
Getting Started
1. Create Your Azure Account
- After setting up your subscription navigate to portal.azure.com.
- Create a VM (this step can take some time). Click on “Virtual Machine” at the top menu.
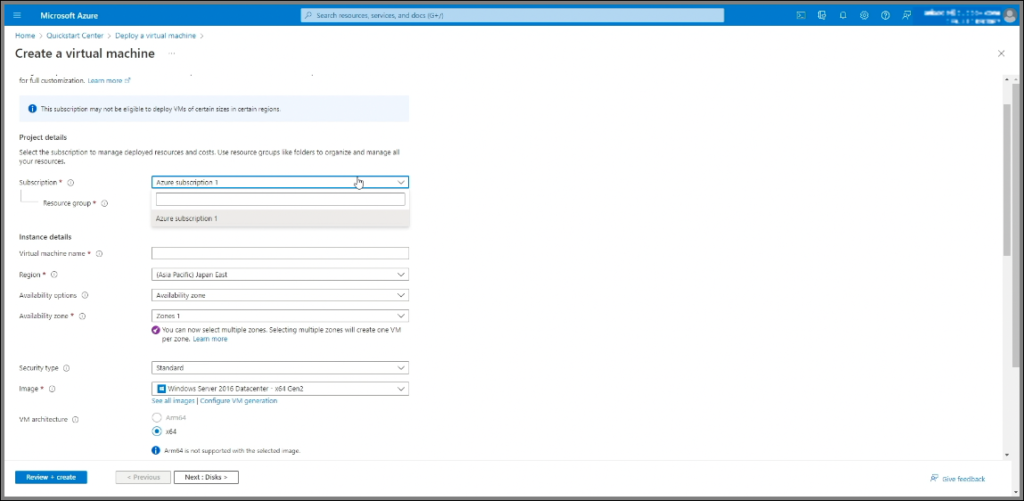
2. Set Up a Resource Group
- Create a new resource group named honeypot-lab to group all resources. A resource group is a logical container in Azure, grouping resources with similar lifespans.
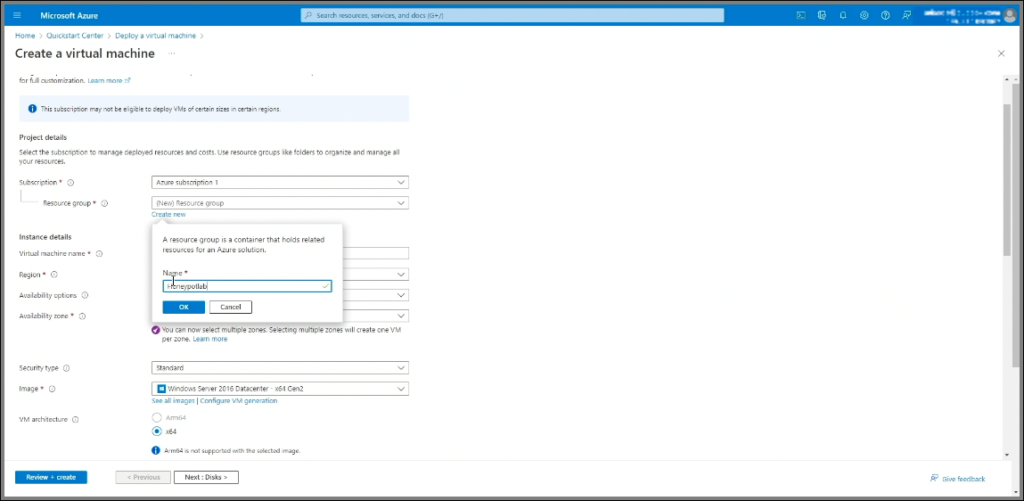
3. Name the VM
- Set the VM name to honeypot-vm.
4. Select the Region
- Choose the geographic region of your VM. This determines the data center where the VM will be hosted. I chose West US 2.
5. Choose the Image
- Keep the default image (e.g., Windows 10 Pro Version 20H2 – Gen1).
6. Set the VM Size
- Use the default VM size.
Note: These settings -region, image, vm size- don’t really matter for this lab so just keep defaults.
7. Configure Login Credentials
- Set up a username and password for accessing the VM.
8. Network Security Group Settings
- Under “Networking,” choose Advanced to create a new Security Group (similar to a firewall).
- Set it to allow unrestricted access from the public internet.
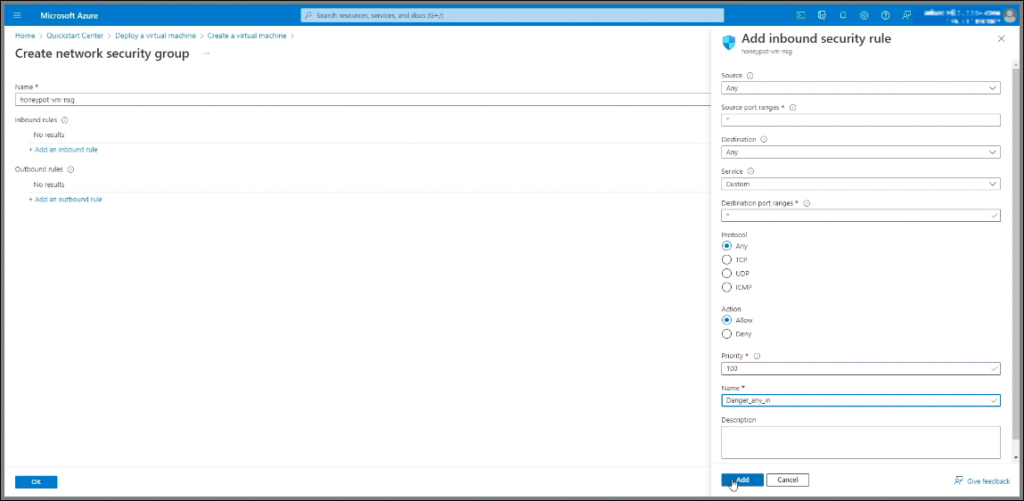
9. Adjust Inbound Rules
- Remove the default rule and create a custom inbound rule to allow all traffic to the VM.
- For this, set the destination port to
*(any), protocol to any, action to Allow, and priority to a low number like 100. Name it (e.g., danger-any-in) to indicate that it allows all traffic.
10. Review and Create
- Click “Review and Create” to finalize the VM setup.
The goal for this lab is to ensure the VM is highly discoverable through any method, whether adversaries are using TCP pings, SYN scans, or ICMP pings. We want the VM to accept all incoming traffic without dropping packets, making it easy and quick to detect.
Log Analytics Workspace Setup
Note: While the VM is being created, we’ll set up a Log Analytics workspace. This workspace is essential for ingesting logs from the VM, specifically Windows event logs, along with custom logs that include geographic data. This custom logging will help us pinpoint attacker locations. Our SIEM tool, Azure Sentinel, will connect to this workspace to display geographic information visually on a map.
- Create a Log Analytics Workspace
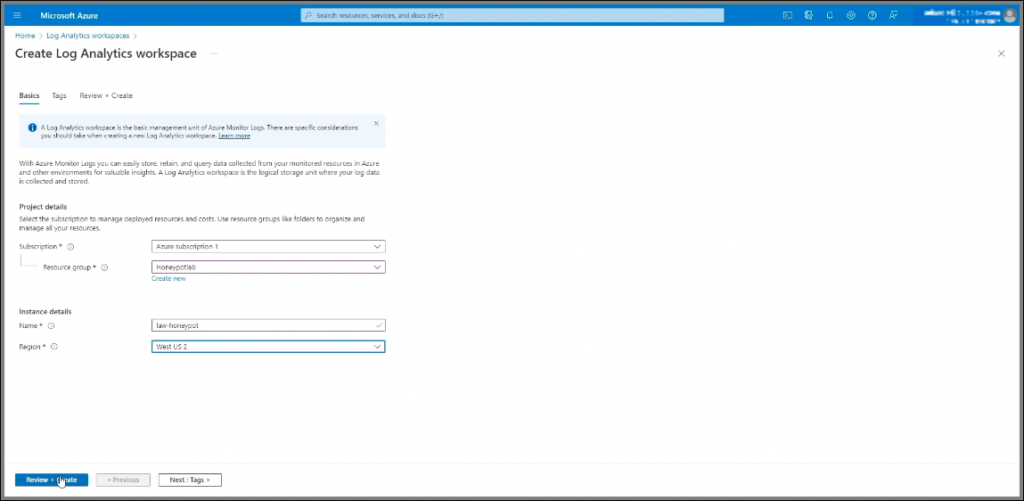
- Navigate to Log Analytics and create a workspace in the honeypot-lab resource group.
- Select
honeypot-labas the resource group. - Name it law-honeypot and set the region to West-US2 -or to whatever you chose in step 4. (law stands for Log Analytics Workspace)
- Review and Create the Workspace.
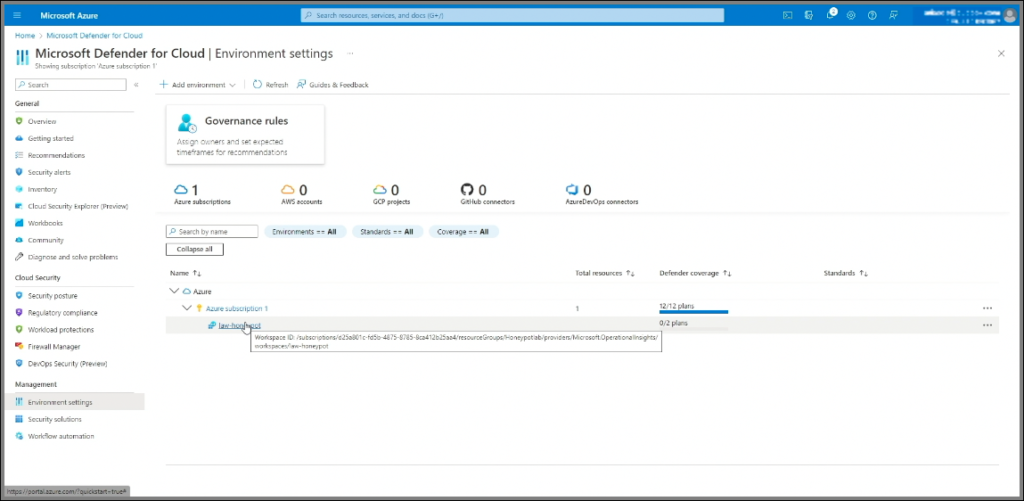
- Link Microsoft Defender for Cloud
- Navigate to Microsoft Defender for Cloud (formerly Security Center) and link it to your Log Analytics Workspace.
- Once in Microsoft Defender for Cloud go to Environment Settings under Management tab.
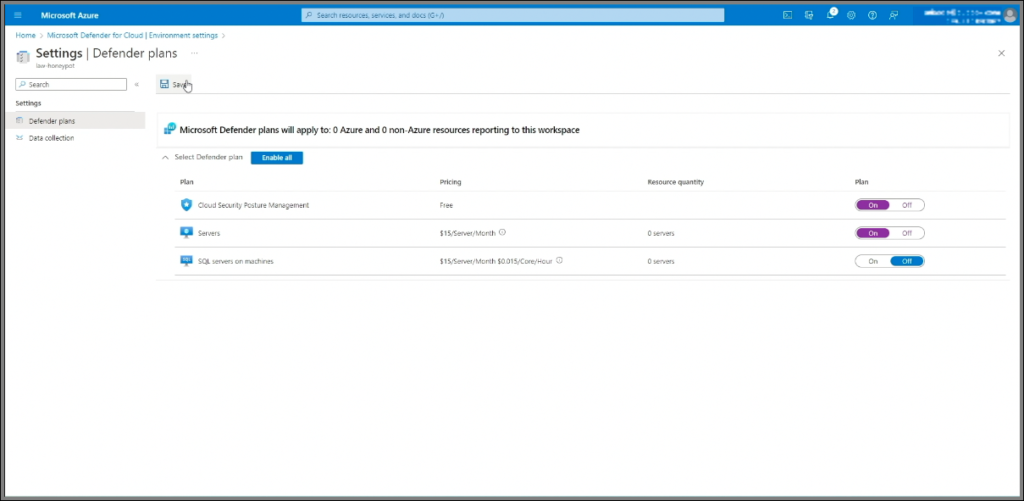
- Enable Cloud Security Posture Management and Servers.
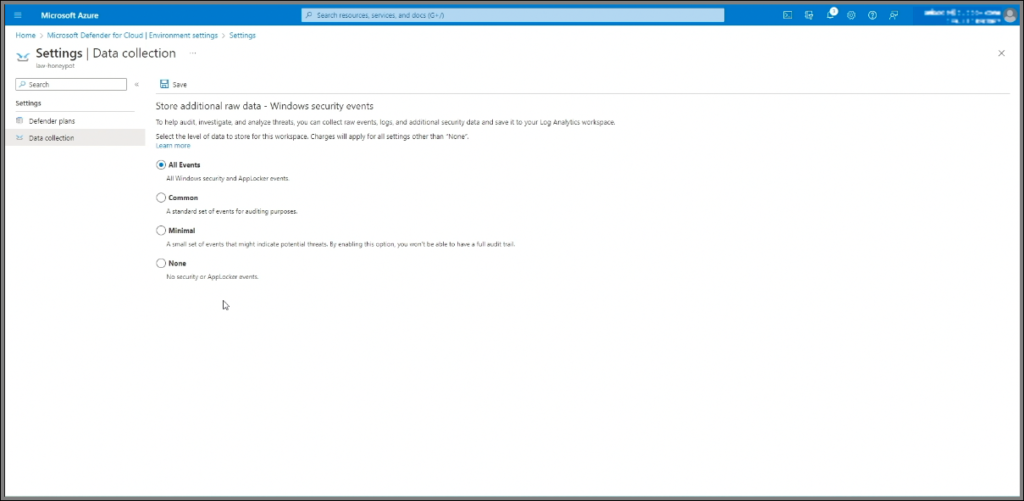
- Enable log collection for All Events to capture security logs from the VM, which Sentinel will later analyze.
- Under Data Collection, select “All Events” to ensure comprehensive log collection, then save the configuration.
- Connect the Workspace to the VM
- In Log Analytics, find the created VM under Virtual Machines and click Connect. While this is processing, open a new tab.
Note: This step was missed in the editing of the Youtube video. I uploaded the missing step in a separate video which you can find here.
- In Log Analytics, find the created VM under Virtual Machines and click Connect. While this is processing, open a new tab.
- Set Up Azure Sentinel
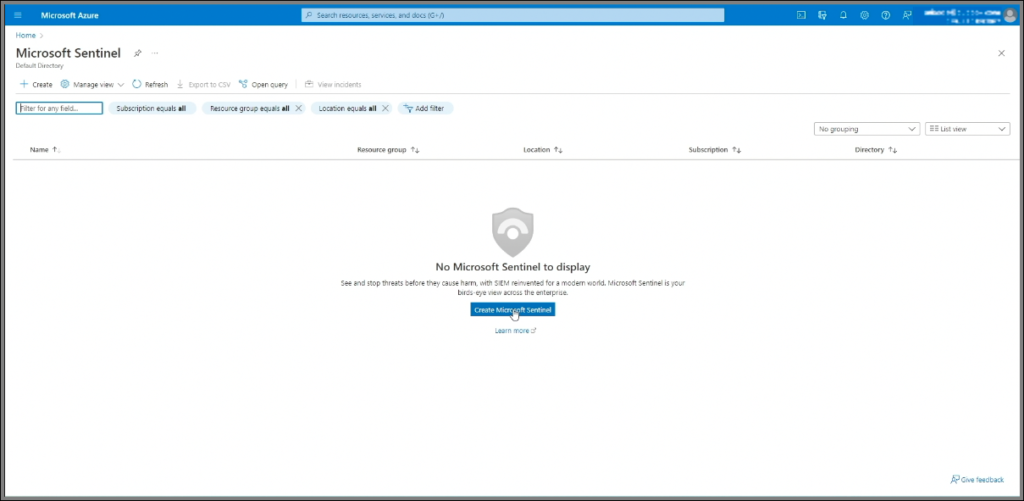
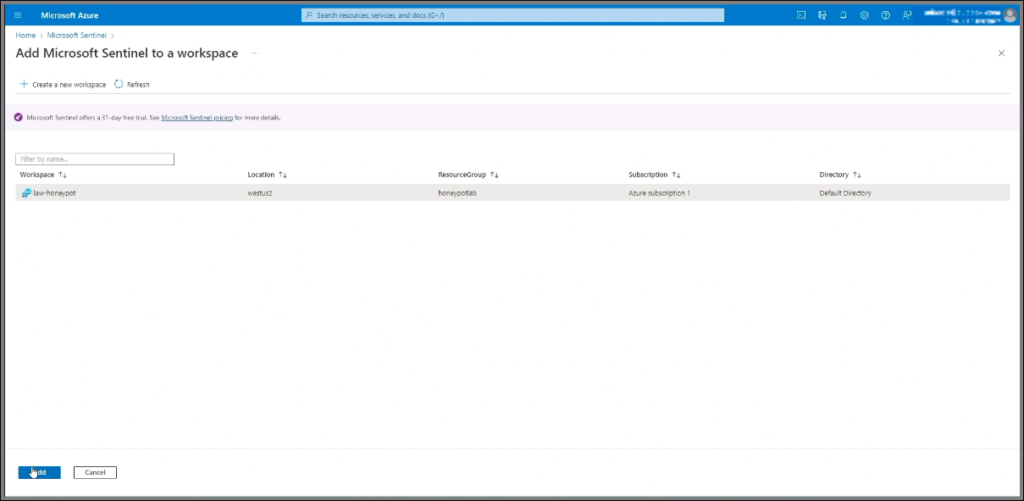
- In the Azure portal (portal.azure.com), set up Azure Sentinel (this will only take a moment). As our SIEM platform, Sentinel will allow us to visualize attack data.
- Go to Azure Sentinel, create an instance, select the Log Analytics Workspace we created, and add it. Allow Sentinel to finish setup in the background.
- Return to the Log Analytics tab and check the connection status to the VM.
Working on the VM
1. Access the VM
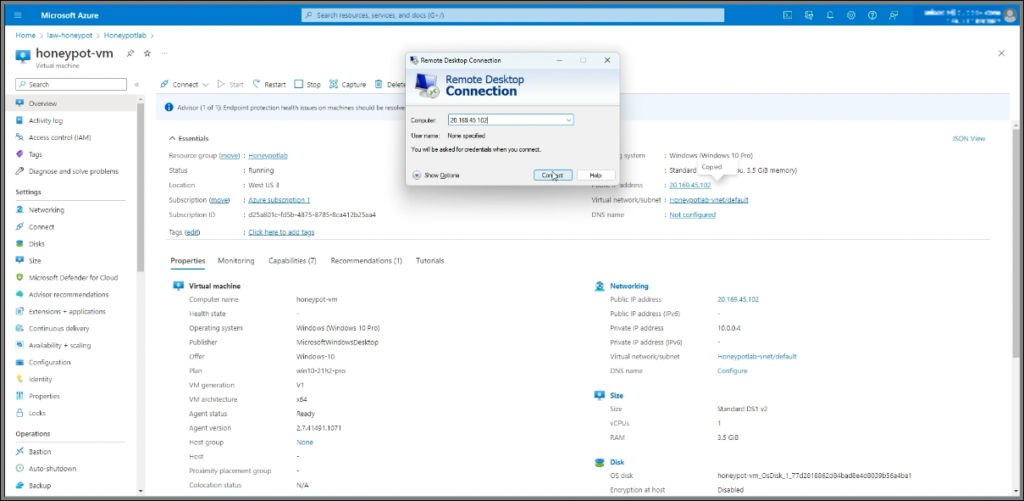
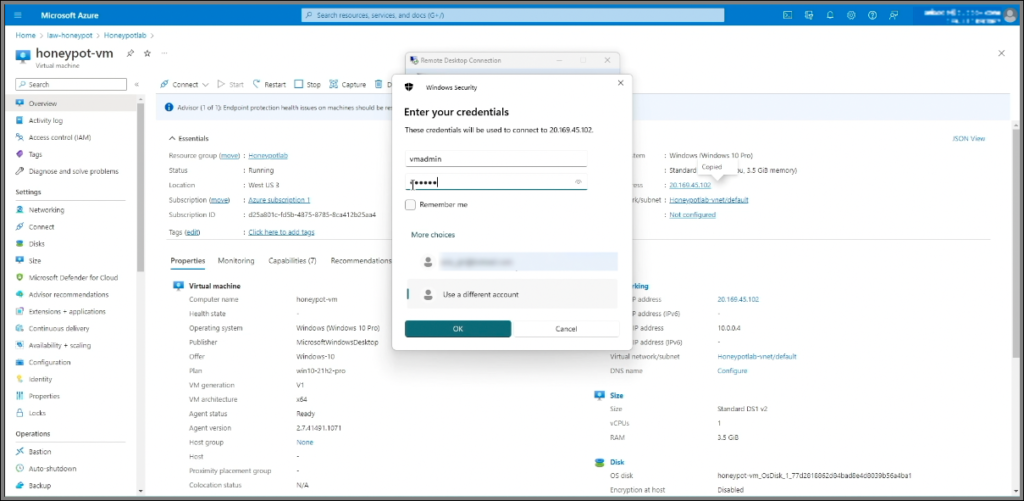
- Once the setup mentioned above completes, select the VM and click on the public IP address to initiate a Remote Desktop connection.
- Open Remote Desktop on your computer, enter the IP address, and adjust any display settings as needed.
- Click Connect, select More Choices, then Use a Different Account. Enter your username and password, accept the certificate warning, and connect.
2. Open Event Viewer
- Once logged in, navigate to Security logs in Event Viewer.
3. Test IPGeolocation API
- Enter an IP address in the API to view returned information (country, state, latitude, etc.).
Note: We’ll use this data to create a custom log that will be sent to the Log Analytics Workspace in Azure. Using Sentinel as our SIEM, we’ll display attacker locations on a map by reading this geodata.
4. Disable Firewall
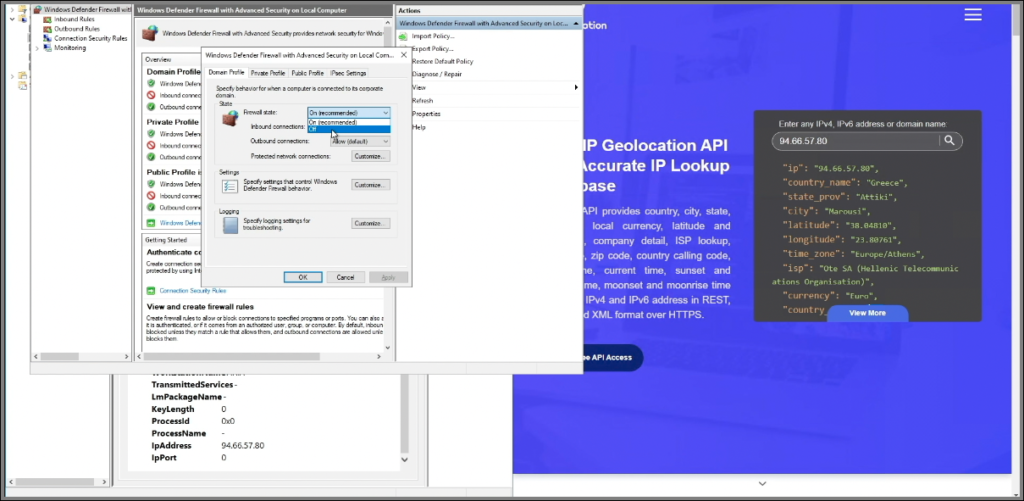
- Disable the firewall to allow ICMP echo requests, enabling ping responses.
- Attempt to ping the VM from your computer to confirm that it currently blocks these requests.
- On the VM, open the firewall (search for
wf.msc). We could just enable ICMP, but for this honeypot let’s just fully disable the firewall. - Go to Windows Defender Firewall Properties, turn off the firewall states for Domain, Private Profile, and Public, then apply the changes and minimize the VM window.
- Ping the VM again to verify it now responds, then close the command line.
5. Download the PowerShell Script
- In the VM, copy the script content from GitHub, paste it into PowerShell, and save it on your desktop as
Log_exporter.ps1.
6. Obtain an API Key
- Obtain an API key by signing up at IPGeolocation and paste it into the second line of the script.
- This key will allow the script to convert IP addresses to latitude and longitude.
7. Run the Script
- The script scans event logs for failed login attempts while extracting IP addresses and retrieves geolocation data from each IP using the API. Then it creates a custom log file,
failed_rdp.log, inC:\ProgramDataand populates it with sample records. We’ll use these initial records to train Log Analytics Workspace to recognize and parse our custom logs. When we later query the data, we’ll exclude these sample entries.
Note: ProgramData is a hidden folder, so navigate manually to locate it or go to Advanced settings and under the View tab select “Show hidden files, folders, and drives”. - Try intentionally logging in with incorrect credentials, then run the script and review the output. Pay close attention to the section highlighted in purple, which displays failed login events.
8. Set Up Custom Logs in Log Analytics
Next, we’ll set up a custom log in our Log Analytics workspace to bring in geolocation data from our custom logs.
- In Azure, search for Log Analytics, open our workspace (e.g.,
honeypot), then go to Custom Logs and select Add Custom Log. - You’ll be prompted to upload a log file, but since the log file is on the virtual machine rather than the host, we’ll need to transfer the data.
- Go back to the VM, open the
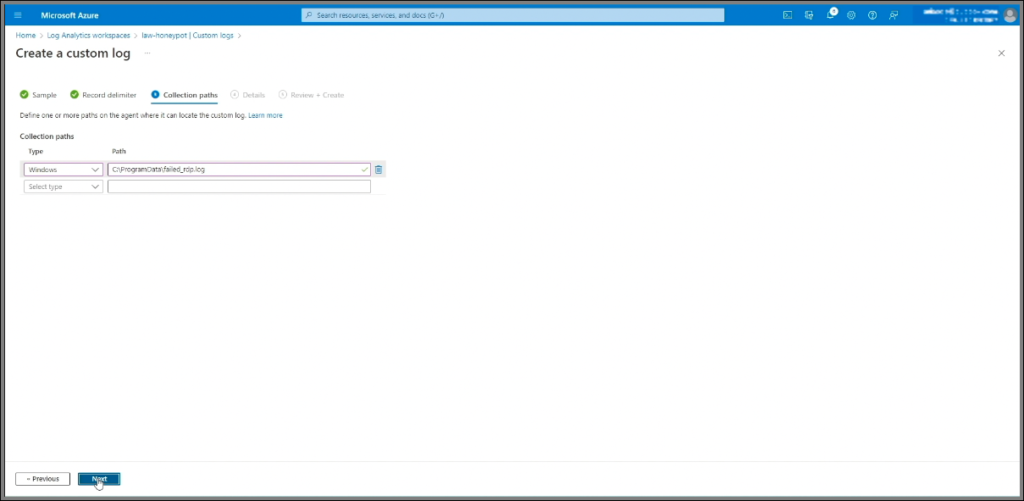
failed_rdplog file, copy all the records, then open Notepad on your local machine, paste the contents, and save the file to your desktop. This file will help train Log Analytics on the format and structure of the log data. - Back in Log Analytics, select the saved file, click Next, and set the collection path to
C:\ProgramData, which is where the log file resides on the VM. Name the custom logFAILED_RDP_WITH_GEOand proceed through the setup.
The custom log will be created immediately, but it may take some time for the VM and Log Analytics workspace to sync, allowing log entries to appear in the workspace.
9. Verify Logs
- To verify, go to Logs, type
FAILED_RDP_WITH_GEOin the query box, and hit Run. If no results appear yet, try querying the default Windows event logs by searchingSecurityEvent. - To see failed RDP attempts specifically, add a filter by expanding the query to
| where EventID == 4625, then run it again. Allow about 10-15 minutes for full synchronization.
Creating Custom Fields
1. Extract Fields from Raw Log Data
- Our next step is to extract specific fields from the raw custom log data. To do this, open one of the logs, right-click on it, and select Extract Fields. Highlight each relevant field, assign it a name, and verify the accuracy.
- If anything looks incorrect, click Modify this Highlight to adjust the selection and refine the extraction. This process helps train the extraction algorithm to recognize the data fields correctly.
Note: This section has been updated. Please refer to the user feedback at the beginning of the project write-up or check the comments on the YouTube video for the latest instructions.
2. Test Field Extraction
- To confirm field extraction is working, attempt a failed login to generate an event. Then, check Log Analytics to see if the custom fields appear correctly within the logs.
Setting Up the Attack Map in Sentinel
1. Create a Workbook
- In Sentinel, go to Workbooks, add a new workbook and click Edit.
2. Add a Query
- Remove any default widgets, then add a new query.
- Enter the following query to retrieve geolocated failed login events:
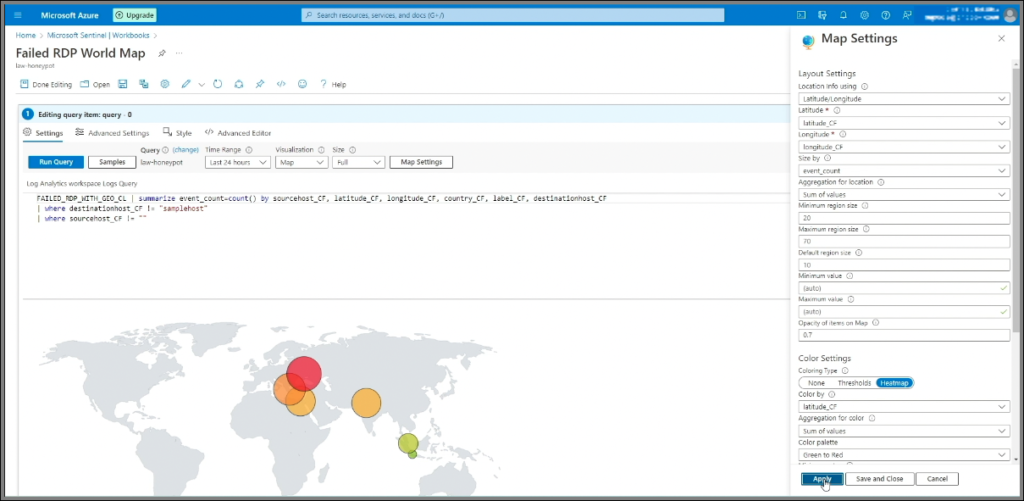
FAILED_RDP_WITH_GEO_CL | summarize event_count=count() by sourcehost_CF, latitude_CF, longitude_CF, country_CF, label_CF, destinationhost_CF | where destinationhost_CF != "samplehost" | where sourcehost_CF != "" - Run the query.
3. Visualization Settings
- Under Visualization, select Map and configure the settings to display location info using latitude and longitude.
- In the map settings, choose Location info using latitude/longitude, set the latitude and longitude fields accordingly, and for Metric Label and Metric Value, choose
label_CFandevent_count, respectively. - To size map points by event frequency, set the Size by option to
event_count.
4. Customize and Save the Map
- Set the map to full size, save it as Failed RDP World Map, and configure it to auto-refresh every 5 minutes.
Monitoring and Cleanup
- Enjoy monitoring attack patterns on the map.
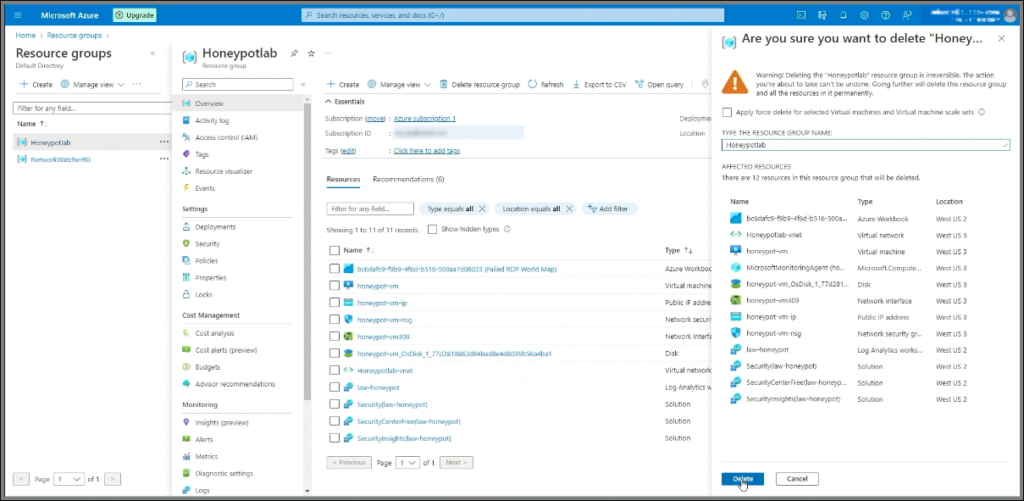
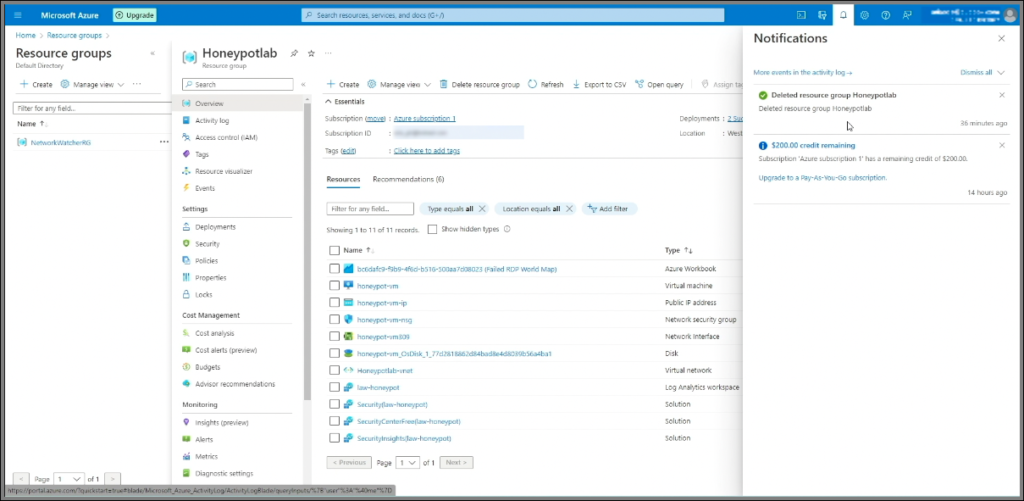
- When finished, delete the resource group to clean up.
Conclusion
Congratulations on completing the project! You have successfully set up an Azure Sentinel honeypot and visualized attack data on a map. This project demonstrates essential cloud security monitoring skills.
For further exploration, consider researching advanced security practices in Azure or other SIEM tools.